About Me
Hi there! I’m Ibrahim. I am currently a Master of Sport Analytics student at La Trobe University in Australia.
I created this page to showcase my projects and technical growth. Coming from a background in Sport Science with experience in health coaching and youth strength & conditioning, I have always loved the challenge of optimising human/athletic performance. I enjoy piecing together the ‘human performance puzzle’ to find individualised solutions. Through this work, I realised I relished the process of quantification (the whole “Assess, don’t guess” spiel). This naturally led to a fascination with data visualisation and- more importantly- the power of a data-informed approach to aid decision-making and analytical workflows.
My current areas of interest include:
- Performance Science: Supporting elite athletes in various sports (including Athletics, Water Polo, Badminton) through video or data analysis.
- Enhancing workflow processes: Identifying bottlenecks in workflow processes and implementing tech-aided solutions that improve productivity.
![]()
Now learning:
Portfolio
A platform built to evaluate Singapore Premier League players using event data powered by Hudl Wyscout. This tool translates raw statistics into actionable recruitment insights through statistical normalisation, reducing a scout’s player review time from hours of raw stats to a single radar comparison.
Key Functionalities:
- Z-Score Standardisation: Comparing players on a balanced league-wide scale ($0$ = League Average) to identify elite outliers.
- Head-to-Head Radar Profiles: Visualizing strengths and weaknesses across shooting, progression, and defensive metrics.
- Performance Differential: Automated “Delta” tables calculating the specific statistical edge one player has over another.
- Local Talent Filter: A specialized view for domestic player identification and tracking.
Singapore Premier League – Early-Season Analysis
Jan 2026
As Singapore Premier League action returns, I used simple but informative visual ranks to compare players’ key chance-creation and goal threat metrics to highlight early standouts and underperformers across the league.
With most having at least 4 games under their belt, here's a look at the goalscorers so far.
— Ibrahim Nasaruddin (@Ibranalytics) January 15, 2026
NOTE: Excluded players with 0 xG AND 0 goals pic.twitter.com/r505VDI7Xf
 Standard classification models ask if a player will get injured (Yes/No). Survival Analysis asks when.
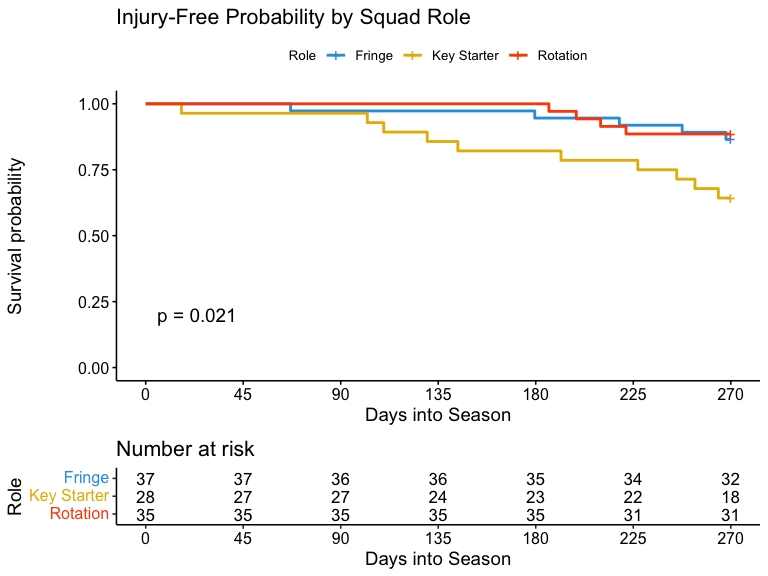
By failing to account for time and exposure, binary predictions often miss the nuance of accumulated fatigue. This project uses Survival Analysis to model the “time-to-event” for non-contact injuries in a simulated 25-man squad over 4 seasons. Potentially helps performance staff prioritise load management for high-risk players before injury occurs
Key Concepts Covered:
- Right Censoring: Handling data for players who don’t get injured.
- Kaplan-Meier Curves: Visualising the “135-Day Wall” where injury risk spikes.
- Cox Proportional Hazards: Quantifying the “cost” of being a Key Starter (Hazard Ratios) vs. a Fringe player.

Tech Stack:
![]()
A dashboard inspired by my work with the High Performance Sport Institute (HPSI). I designed this tool to explore and streamline the analysis workflow, automating the ingestion of mock Hudl Sportscode data to move beyond manual reporting. i.e. it shifts post-match analyst workflow from manual Sportscode tagging to automated insight generation.
By shifting the focus from data entry to tactical exploration, it empowers analysts to prioritise coaching conversations. Key features include dynamic pass networks, momentum tracking, and defensive KPI visualisation.
View Source Code on GitHub
A behind-the-scenes look at my work as a Performance Analyst Assistant at the High Performance Sport Institute (HPSI), where I support Singapore’s national athletes in athletics leading up to the SEA Games 2025. Also have a listen by the athletes on how they feel analytics supports them!
Predictive Modelling with Machine Learning in Sport Analytics
November 2025
View on RPubs : https://rpubs.com/mibrahim_nsrdn/1362119
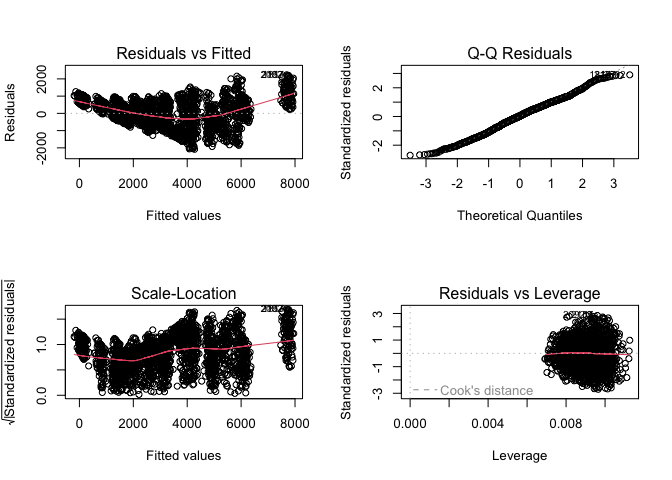 Comprehensive guide covering the fundamentals of predictive modeling and machine learning in sports analytics. Explores data preparation, model building, hyperparameter tuning, and interpretation using R programming.
![]()
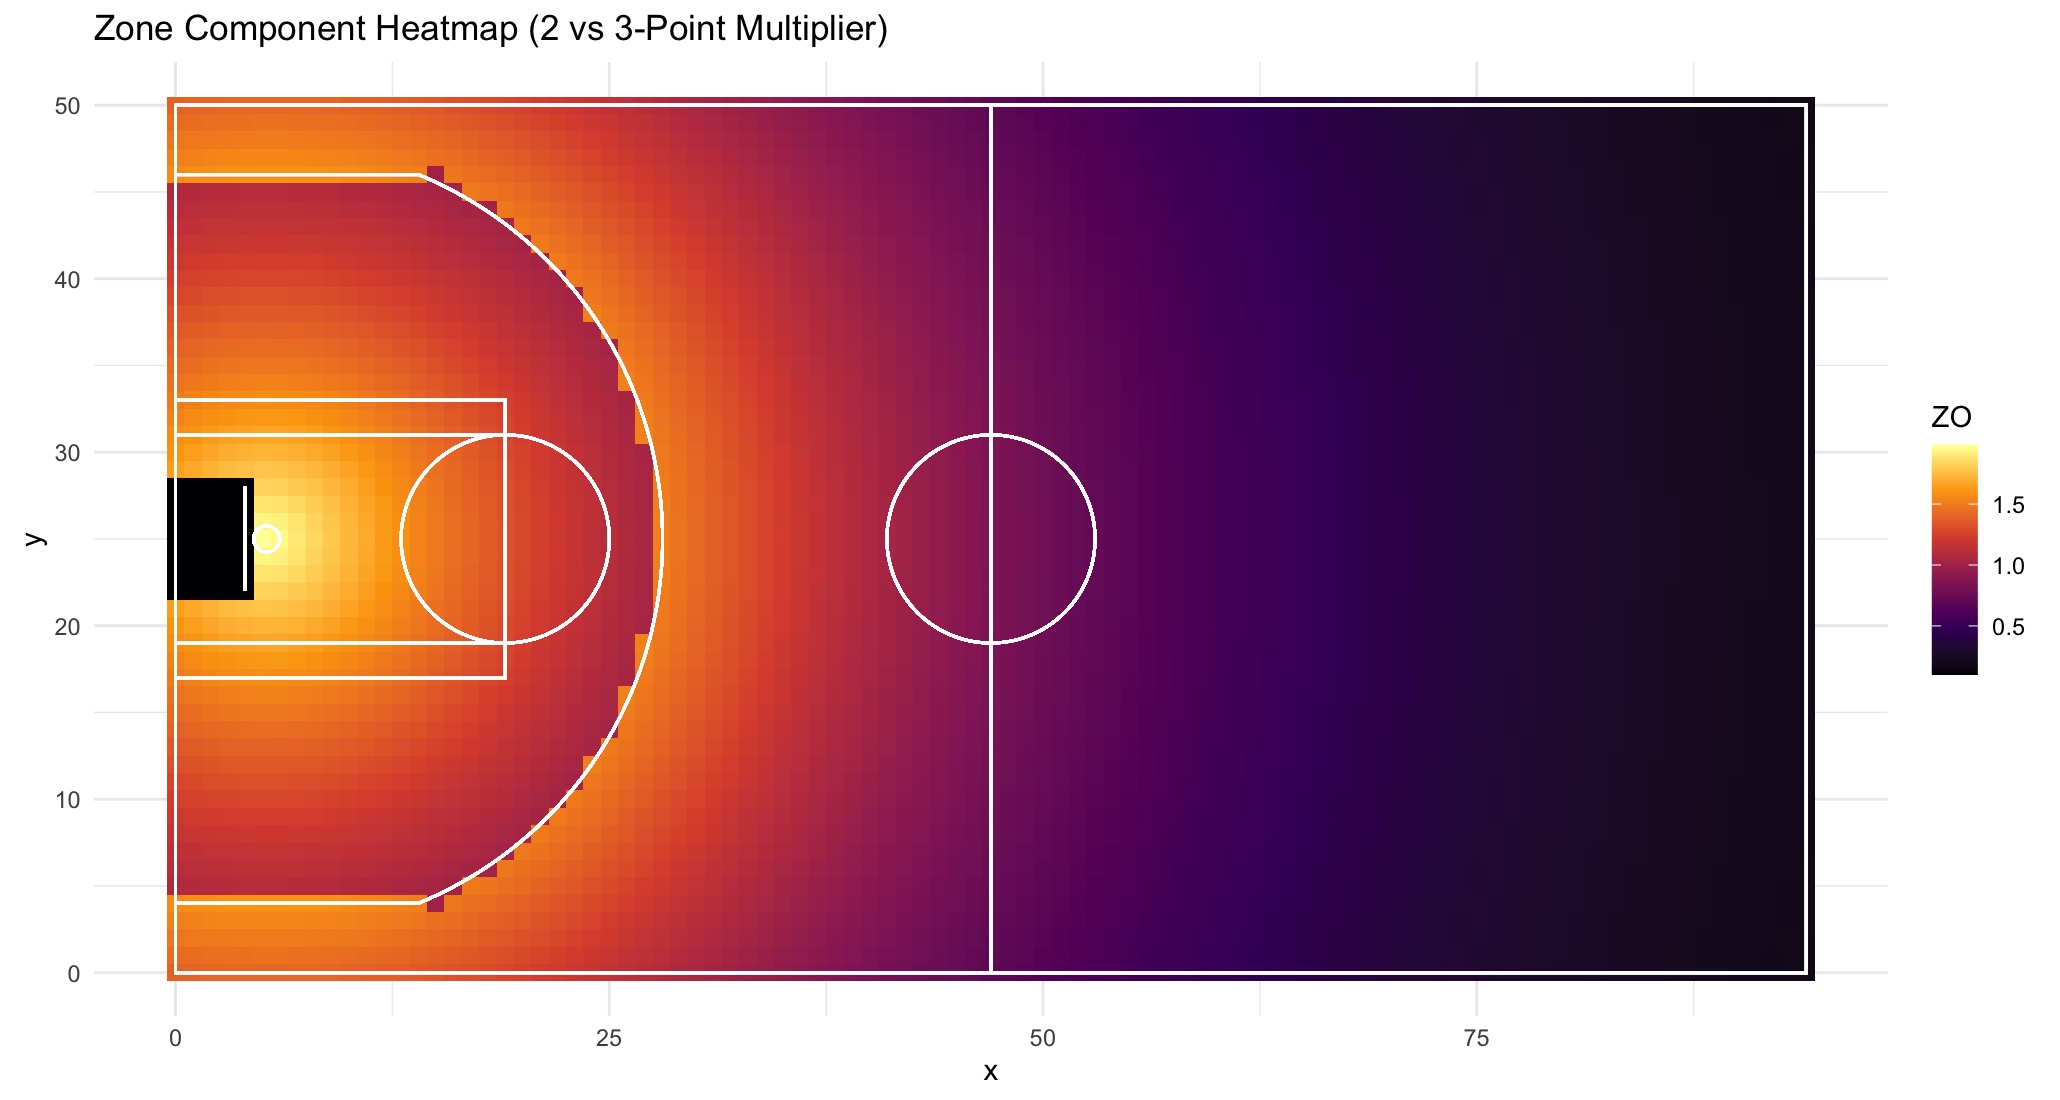 This project adapts the “Dangerousity” construct—originally developed for football analytics by Link et al. (2016)—to the sport of basketball. The objective was to quantify the instantaneous probability of a player scoring based on spatiotemporal tracking data.
The Framework:
- Zone (ZOb): Quantifies spatial scoring probability based on distance and angle, adjusted for 2-point vs. 3-point incentives.
- Control (COb): Dynamic calculation of the ball handler’s control based on speed and dribbling status.
- Pressure (PRb): Defensive intensity measured by Euclidean distance to defenders and contextual time pressure (shot clock/game clock).
- Density (DEb): Analysis of obstruction in both the “Shot Corridor” and “Passing Lanes.”
Predicting Expected Threat (xT) with Random Forest Regression in R
October 2025
View on RPubs : https://rpubs.com/mibrahim_nsrdn/1362155
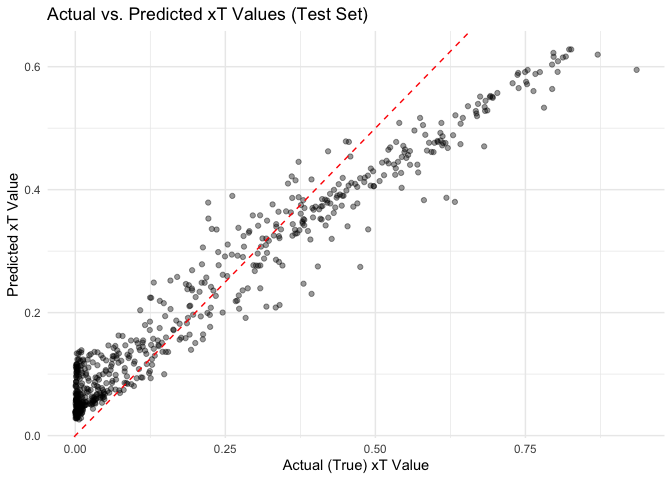 Practical tutorial on building an Expected Threat (xT) model using Random Forest regression to predict scoring probability based on ball position and game context in football analytics.
![]()
Is Your Apple Watch Calculating the Right Heart Rate Zones for Your Cardio Workouts?
July 2025
View on Substack: https://substack.com/home/post/p-168133278
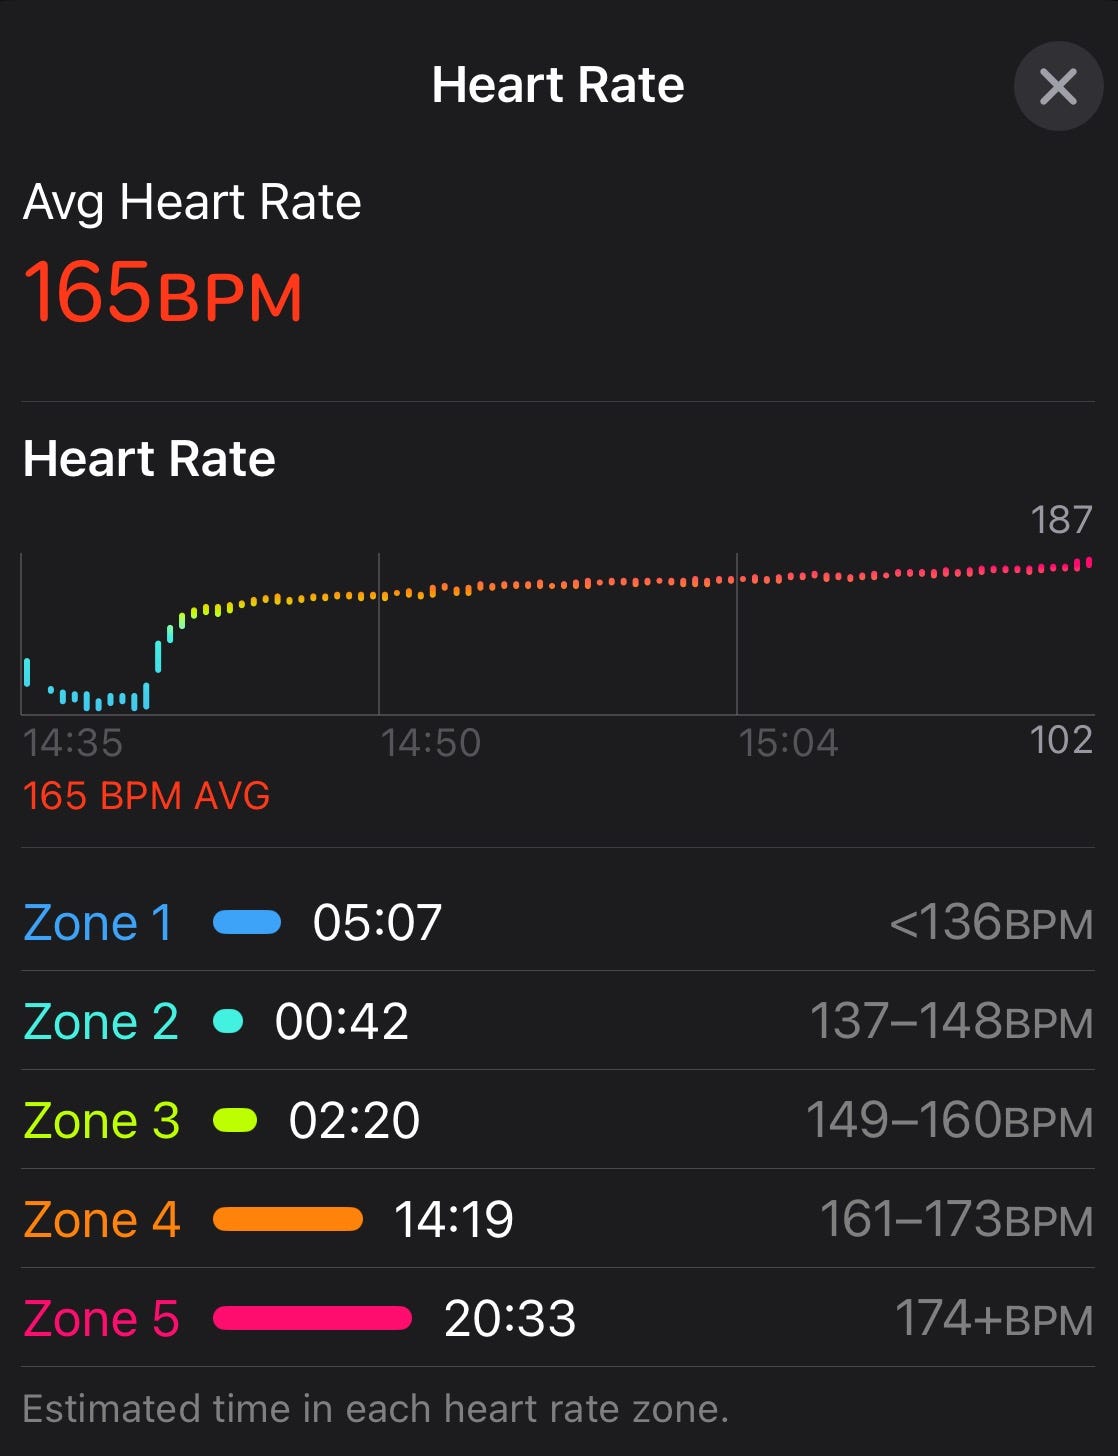 Explores how Apple Watch estimates heart rate zones and why they may not reflect individual physiology. Discusses Zone 5 training (VO₂max intensity), the second ventilatory threshold (VT2), and provides a practical field-based Maximal Aerobic Speed (MAS) test protocol to manually calibrate accurate HR zones for more effective cardio training.
Best Defender for SPL 2024/25 (Part 1)
Jun 2025
View on Substack: https://substack.com/home/post/p-166051519
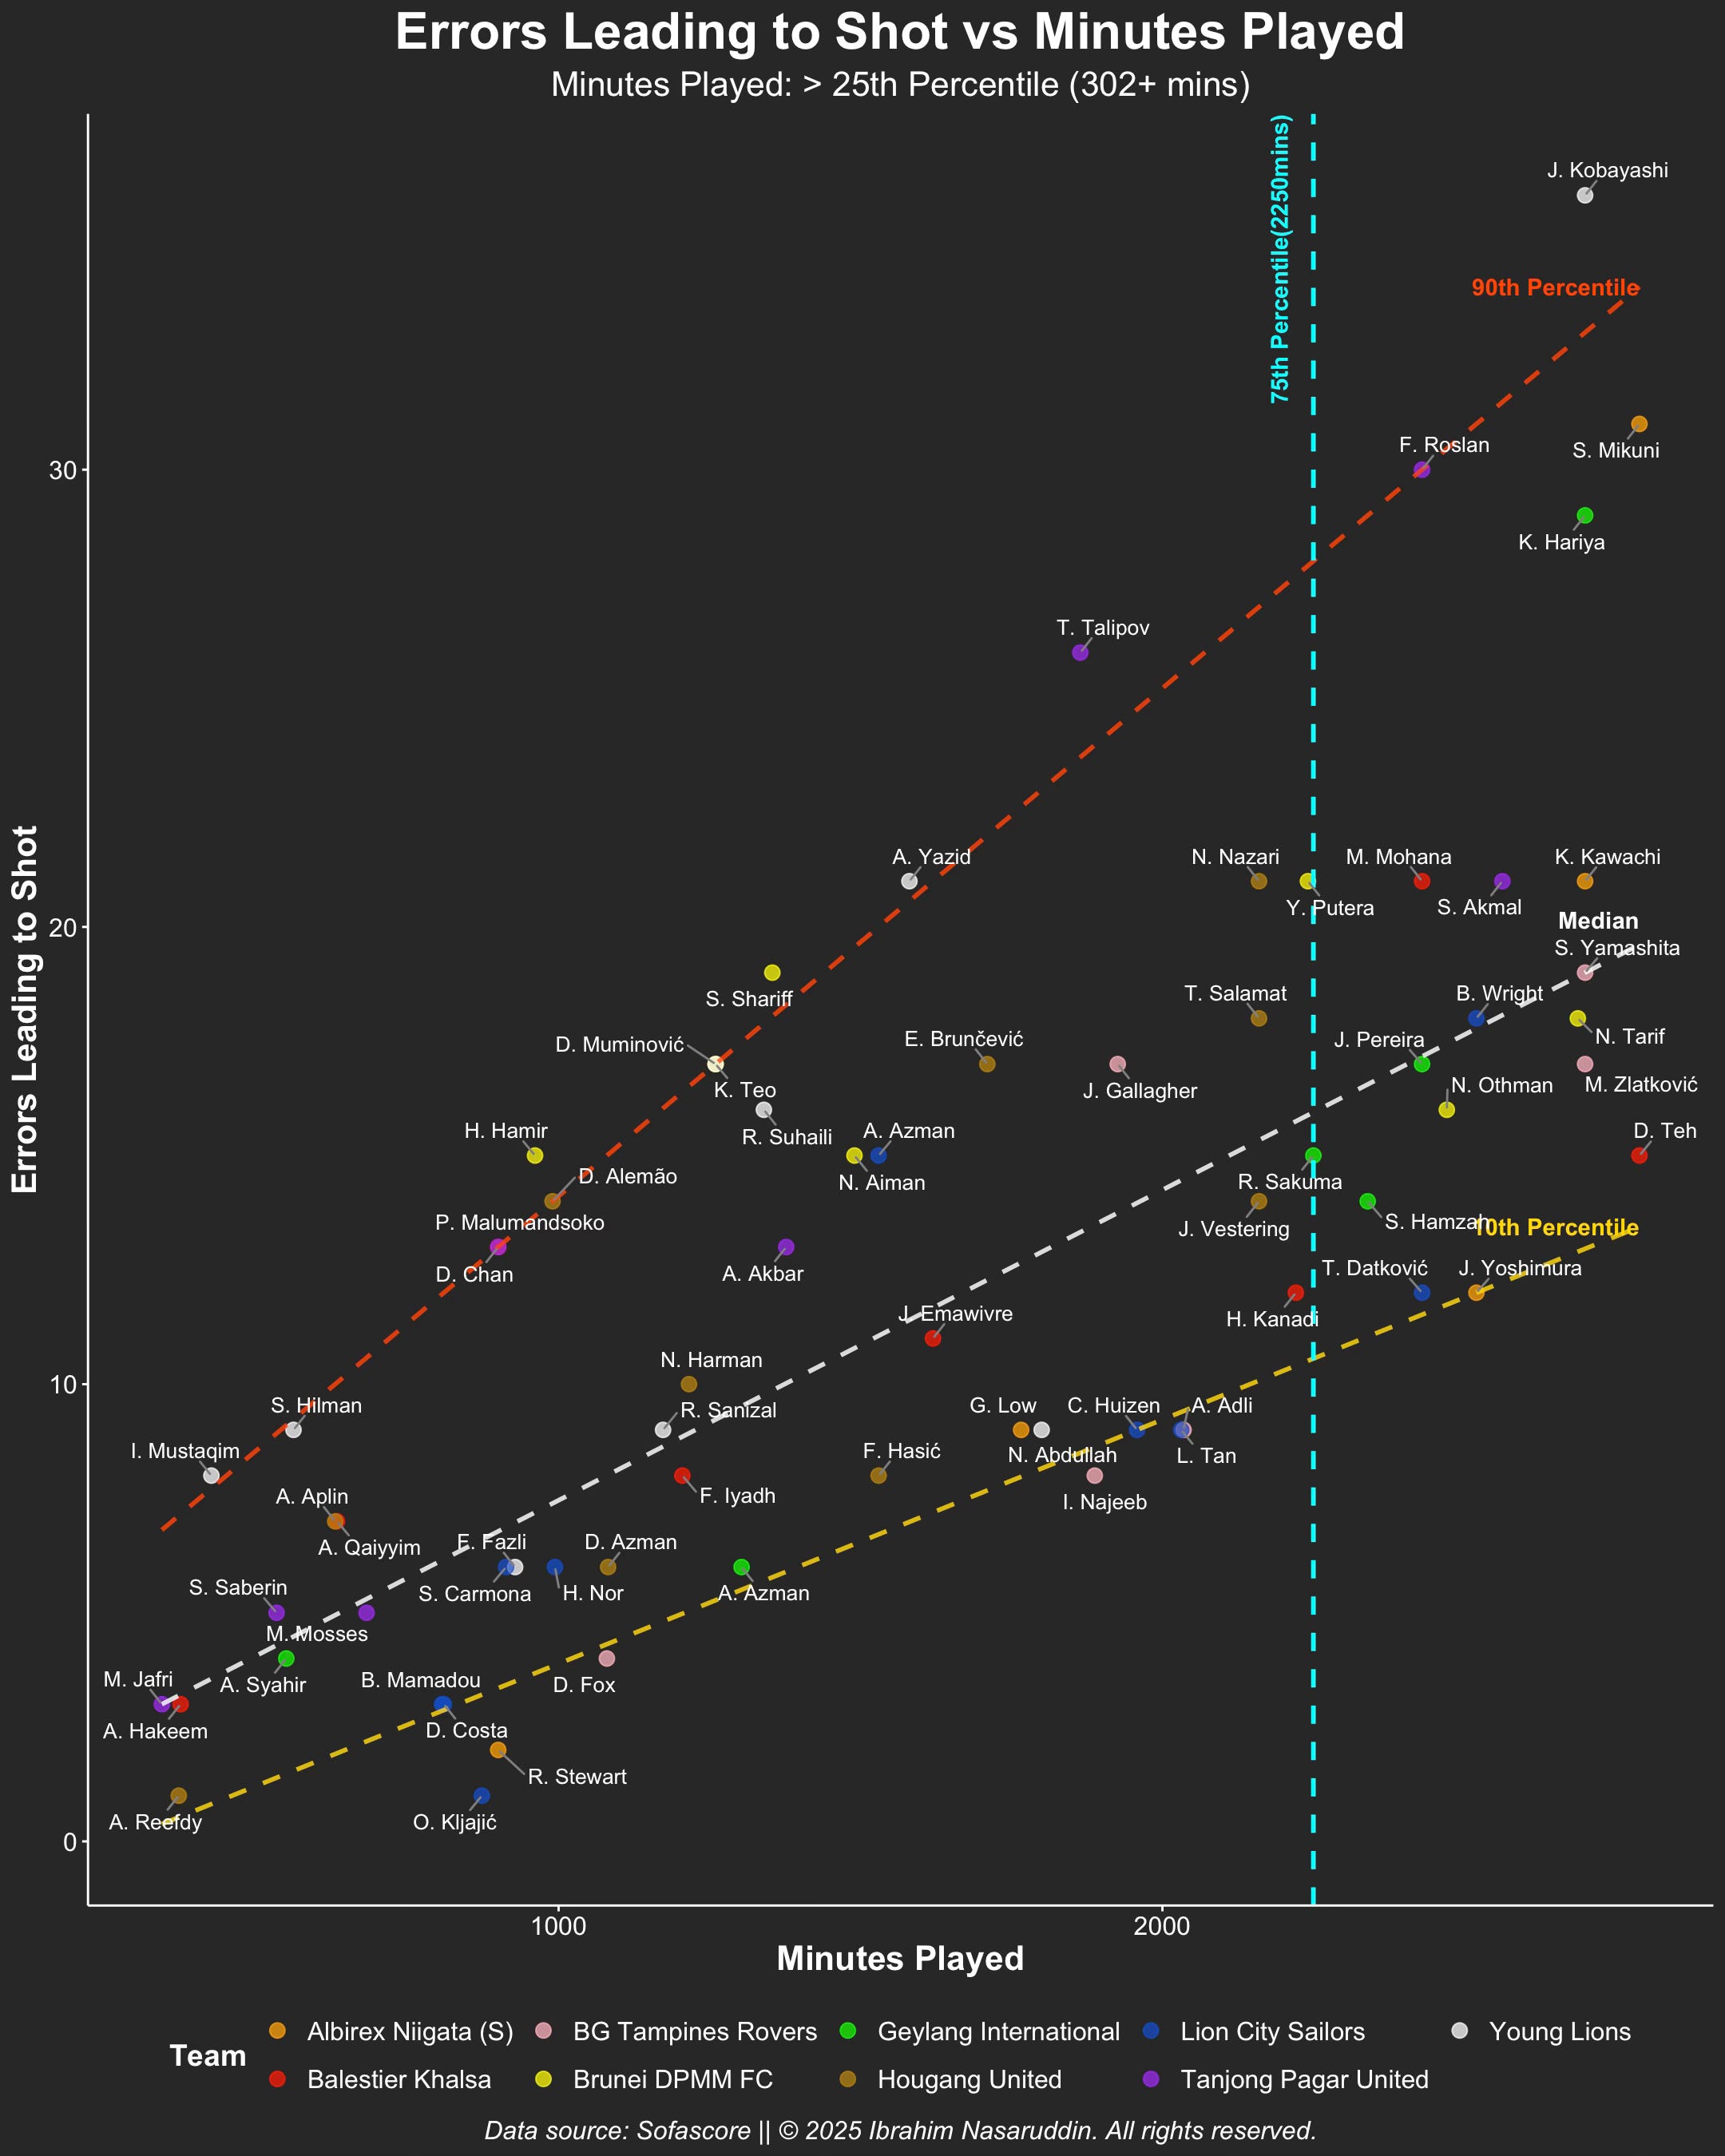 Data-driven analysis of defensive performance in the Singapore Premier League’s 2024/25 season. Examines SPL defenders through objective metrics including duel success rates, clearances, and errors leading to shots. Standout performers include Toni Datković and Bailey Wright.
![]()
Experience
High Performance Sport Institute
Performance Analyst Assistant
Nov 2025 - Apr 2026
Developed an automated R Markdown and Python workflow for post-match and competition reporting, cutting report generation time from 1+ hour to seconds. Evaluated and integrated YT-DLP open-source video downloader into analysis workflows, improving video acquisition speed through multi-parallel downloads for efficient notational analysis. Provided remote and real-time race analysis for athletics events for the 2025 SEA Games.
National University of Singapore
Research Assistant (Exercise Science)
Oct 2023 - Jan 2025
Conducting and interpreting participant tests including VO2max and anthropometric measurements. Performing routine clinical assessments according to Standard Operating Procedures.
MaxForm Pte Ltd
Speed Coach (Freelance)
Oct 2023 - Dec 2024
Planning and delivering speed conditioning programmes for youth athletes.
United World College South East Asia
Health & Performance Coach (Freelance)
Sep 2023 - Jul 2024
Planning and delivering speed conditioning programmes for middle-school athletes and performing evidence-based pre-post speed assessments.
Sport Singapore
Health Coach (Active Health division)
Jul 2021 - Jul 2023
Coached a wide variety of participants by conducting fitness and health assessments, exercise programmes for working adults, seniors and people with chronic diseases. Achievement: 1st runner-up team for an MCCY Data Arcade Tournament 2022, using Tableau to visualise data and problem-solve possible solutions for gaps specific to Sport Singapore.
Sport Singapore
Planning & Research Executive (Active Health division)
Jul 2021 - Jul 2023
Led the “Learning Exercises Against Diabetes” research study and compiled data using Tableau to support operational decision-making. Assisted in the “Health District @ Queenstown” collaboration project.
Home Team Science and Technology Agency
Research Intern
Jan 2021 - Jul 2021
Analysed and visualised data for human factors and simulation trials. Examined physical and physiological demands of frontline specialist vocations to enhance operational readiness.
Education
La Trobe University
Master of Sport Analytics
2025 - 2026 (Expected)
Awarded the LTU High Achiever Scholarship.
Nanyang Technological University
BSc (Sport Science and Management)
2018 - 2021
Honours (Distinction).
Specialisation in Sport Science.
NTU President Research Scholar 2020.
Republic Polytechnic
Diploma in Sport and Exercise Sciences
2016 - 2018
Diploma with Merit.
Director’s Roll of Honours (2017-2018).
Module Prize in Introduction to Sports Coaching.
A Little More About Me
Technical Skills
![]()
Interests
Outside of academic and professional work, I am an avid follower of the Singapore Premier League. I occasionally post visualisation plots of SPL stats on my X account. I love spending time with my family and feel at peace during nature walks.
My non-linear path in sport science
If you had asked me in 2010 what I wanted to do with my life, I wouldn’t have had an answer. I was too busy trying to survive my first year of Junior College. But my obsession with human performance didn’t start in a lab; it started on a track.
That 12-second blur in a 100m race ignited a desire to understand why I was fast. I spent hours dissecting YouTube clips of Asafa Powell, frame-by-frame, trying to understand human force generation.
My journey involved academic hurdles and repeating years, but those moments hardened me. I realized that my previous struggles weren’t a lack of ability; they were a lack of purpose.
When peak curiosity led to peak performance
During National Service, I dove into exercise physiology journals to understand hypertrophy and training zones. I was already thinking like a sport scientist—using data as a lever to understand performance.
The Turning Point: Finding Redemption at RP
The turning point came in 2016 when I discovered the Diploma in Sport and Exercise Sciences at Republic Polytechnic. For the first time, my curiosity was being fed. I realized that true God-consciousness (Taqwa) involves a constant striving toward refining one’s character through the pursuit of excellence (Ihsan).
My Philosophy: Grit & Growth
My philosophy is simple: How can I make a positive difference in someone else’s life? I believe in a growth mindset with an abundance outlook—to collaborate rather than compete. I see my credentials not as a success story, but as an invitation for others to introspect on their own purpose and unlock their potential.